Tariffs Bad, Made in America Good, See Article on Left
All material provided on this web site is copyrighted with the US Copyright Office Copyright © 2019 by Clint Kennedy |
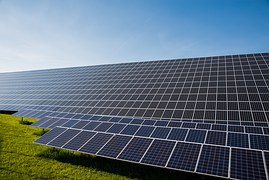
Solar Energy Good!!!
|
- Home
- Tariffs Bad, Made in America Good, June 2018
- What Should I Invest In? The Basic Economic View, August 2015
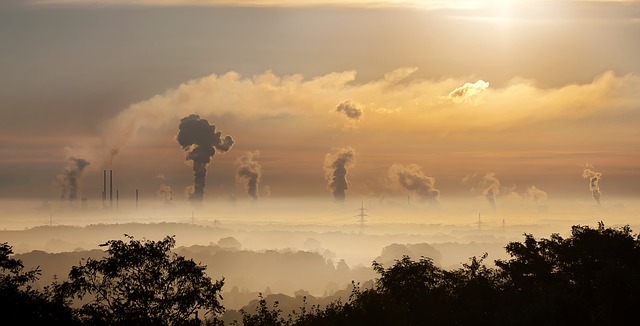
- Global Warming, The Basic Economic View
- Economic Forecast, July 2015
- What is Economics?, October 2011
- Prioritizing Investments Made by Households, June 2011
- Economic Forecast, July 2014
- Economic Forecast, November 2012
- The Economic Views of Presidential Candidates, Updated May 13, 2012
- Another Global Economic Crisis? October 2011
- The Debt Debate, July 2011
- Links to Economic Web Sites
- Economic Indicators, BEA Update June 24, 2011
- Some Good Investments in Hard Times, July 18, 2011
- International Impacts on the US, July 14, 2011
- Links to Data and Graphs
- Latest Updates
- Blog
- Basic Economics Today Book Release
- Contact Info.
- Advertising
- Consult Basic Economics Today LLC
- Under Construction
- New Page